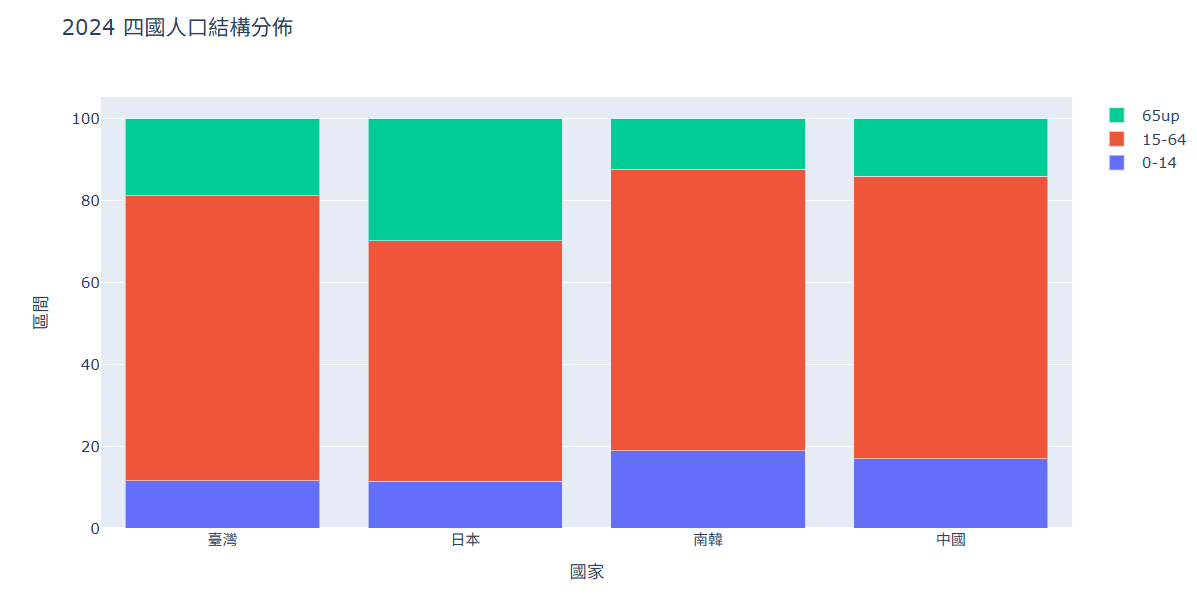
人口結構分佈
-
台灣歷年人口(.csv) population_taiwan_age2024.csv
世界0-14歲歷年人口(.csv) population_world_age2024_0_14.csv
世界15-64歲歷年人口(.csv) population_world_age2024_15_64.csv
世界65歲以上歷年人口(.csv) population_world_age2024_65_plus.csv
# 匯入numpy套件,為了簡化程式碼,將它套件另外命名成np
import numpy as np
# 匯入pandas套件,為了簡化程式碼,將它套件另外命名成pd
import pandas as pd
# 匯入 csv 套件
import csv

# 匯入plotly套件,以便繪製視覺化圖形
import plotly.graph_objs as go
import plotly.io as pio

# 1. 針對 Colab 的核心設定:指定渲染模式
pio.renderers.default = 'colab'

# 2. 讀取人口數資料
data1 = pd.read_csv('population_taiwan_age2024.csv')
data2 = pd.read_csv('population_world_age2024_0_14.csv')
data3 = pd.read_csv('population_world_age2024_15_64.csv')
data4 = pd.read_csv('population_world_age2024_65_plus.csv')

country = ['臺灣', '日本', '南韓', '中國']

# 4個國家0-14歲的人口比例
p1 = []
# 4個國家15-64歲的人口比例
p2 = []
# 4個國家65歲以上的人口比例
p3 = []

# 臺灣
taiwan_p1 = data1.loc[0]['2024'] # Changed from [65] to ['2024']
taiwan_p2 = data1.loc[1]['2024'] # Changed from [65] to ['2024']
taiwan_p3 = data1.loc[2]['2024'] # Changed from [65] to ['2024']
taiwan_all = taiwan_p1 + taiwan_p2 + taiwan_p3

p1.append(taiwan_p1 / taiwan_all * 100)
p2.append(taiwan_p2 / taiwan_all * 100)
p3.append(taiwan_p3 / taiwan_all * 100)

# 日本
country_p1 = data2.loc[120]['2024'] # Changed from [65] to ['2024']
country_p2 = data3.loc[120]['2024'] # Changed from [65] to ['2024']
country_p3 = data4.loc[120]['2024'] # Changed from [65] to ['2024']
country_all = country_p1 + country_p2 + country_p3

p1.append(country_p1 / country_all * 100)
p2.append(country_p2 / country_all * 100)
p3.append(country_p3 / country_all * 100)

# 南韓
country_p1 = data2.loc[125]['2024'] # Changed from [65] to ['2024']
country_p2 = data3.loc[125]['2024'] # Changed from [65] to ['2024']
country_p3 = data4.loc[125]['2024'] # Changed from [65] to ['2024']
country_all = country_p1 + country_p2 + country_p3

p1.append(country_p1 / country_all * 100)
p2.append(country_p2 / country_all * 100)
p3.append(country_p3 / country_all * 100)

# 中國
country_p1 = data2.loc[45]['2024'] # Changed from [65] to ['2024']
country_p2 = data3.loc[45]['2024'] # Changed from [65] to ['2024']
country_p3 = data4.loc[45]['2024'] # Changed from [65] to ['2024']
country_all = country_p1 + country_p2 + country_p3

p1.append(country_p1 / country_all * 100)
p2.append(country_p2 / country_all * 100)
p3.append(country_p3 / country_all * 100)

# 3. 準備繪圖資料
trace1 = go.Bar(
    x = country,
    y = p1,
    name = '0-14'
)
trace2 = go.Bar(
    x = country,
    y = p2,
    name = '15-64'
)
trace3 = go.Bar(
    x = country,
    y = p3,
    name = '65up'
)

traces = [trace1, trace2, trace3]

# 4. 建立 Layout
layout = go.Layout(
    title='2024 四國人口結構分佈',
    xaxis={'title': '國家'},
    yaxis={'title': '區間'},
    barmode='stack'
)

# 5. 組合並顯示
fig = go.Figure(data=traces, layout=layout)
fig.show()